Executive summary
Artificial intelligence (AI), especially newer generative AI tools, is changing the big labor-market question. It’s less about “Will machines replace people?” and more about “Which parts of jobs will AI handle, which parts will people still do, and how quickly will workplaces adjust?” Many recent reports focus on exposure (how much of someone’s work could be affected) rather than assuming whole jobs will disappear. [1]
Between 2020 and 2025, AI use picked up speed, but it’s still uneven by region, company size, and industry:
- In the EU, the share of businesses (10+ employees) using AI went from 13.5% in 2024 to 20.0% in 2025. Bigger firms lead, and adoption varies a lot by country (e.g., high shares in Denmark[2], Finland[3], Sweden[4]; low in Romania[5]). [6]
- Sectorally, within the EU in 2025, AI use is highest in information/communications and professional services, which makes sense because these jobs are already digital and data-heavy. [7]
- In the US, surveys show adoption is rising but still not common everywhere. One summary suggests AI use grew from about 4.6% of firms (early 2024) to about 10% (late summer 2025), depending on how AI is defined. Worker use is often higher than official firm reporting suggests. [8]
- In China, surveys report high generative AI use among decision-makers, while factories also keep automating using industrial robots. China is the biggest industrial-robot market. [9]
- In India, multiple reports point to fast-growing AI use in businesses, with big potential productivity gains in IT and business services.[10]
Mechanistically, the most robust “first-order” impacts usually look like this: (1) It takes over routine, repeatable tasks.; (2) It helps people do knowledge work faster (drafting, summarizing, coding help, customer support); (3) It changes how jobs are “packaged” by shifting tasks around; and (4) It can raise productivity, which sometimes creates enough growth to offset job losses, depending on demand, regulation, competition, and how quickly people can be trained. [11]
This report includes a scenario-based projection to 2035. It’s meant to be clear and checkable, not pretending to predict the future perfectly. The main outputs are employment index numbers (2025=100) by region, plus sector-by-sector net changes versus a “no-AI” baseline, under three scenarios:
- Conservative adoption: slower rollout, tighter rules, smaller near-term productivity gains
- Moderate adoption: broad use in businesses, lots of “AI-assisted work,” retraining grows but can’t keep up
- Rapid adoption: fast spread across digital work and parts of physical operations (like manufacturing/logistics), with messy adjustment
A simple takeaway from the model: regions with fast labor-force growth (parts of Africa and Asia) can still see job growth even with AI, while aging regions (like the EU and China) face more pressure if productivity gains don’t lead to enough new demand for work. [12]
AI adoption across industries and regions from 2020 to 2025
It helps to think about AI adoption between 2020 and 2025 in three layers: (1) capability availability – the tools exist: models, computing power, software, (2) enterprise deployment – companies build AI into how they run: process redesign, systems integration, and (3) worker-level tool use – workers use tools day-to-day, sometimes before the company officially approves it. In practice, employees often start using AI quietly (“shadow use”), and the organization catches up later with policies and purchasing decisions. [13]
Europe
AI use in EU businesses rose sharply: 20.0% of enterprises (10+ employees) used at least one AI technology in 2025, up from 13.5% in 2024. [14] Adoption varies widely by country (roughly ~5% to ~42%), with Nordic countries leading. [15]
Where you see the most AI use is a clue to where job tasks will change first: in 2025, “information and communication” was above 60%, and “professional services” was above 40%. Many other sectors were under 25%. [7]
A useful country case illustrates barriers: in Italy[16], the national statistics institute ISTAT[17] reported AI adoption among firms (10+ employees) doubling in 2025 versus 2024, but highlighted constraints such as skills gaps, unclear rules, data protection concerns, and cost. [18]
United States
In the US, there’s often a gap between what companies say they’re using and what workers are actually doing. One survey-based summary shows firm use rising from ~4.6% (early 2024) to ~10% (Sept 2025). Meanwhile, worker use can be higher, especially in information-heavy roles, because people change their workflows with consumer tools before formal company rollouts. [8][13]
China
China’s pattern looks like two things happening at once: lots of experimentation with generative AI plus strong capacity for automation in manufacturing. A 2024 survey reported 83% of Chinese decision-makers using generative AI. [19]
On the production side, China is still central in industrial robotics. The global robotics industry body International Federation of Robotics[20] reports that China is the largest market for industrial robot installations and that global installations reached a new high in 2023. [21]
India
Signals in India come from government-linked releases from Press Information Bureau[22] and major enterprise surveys (NASSCOM AI Adoption Index [23]). These point to fast-growing AI activity, especially among large firms and sectors like IT/telecom. [24]
In parallel, industry studies also suggest meaningful productivity gains in IT services as pilots move into scaled production use, which often looks like “people + tools” rather than straight replacement. [25]
Southeast Asia, Africa, and Latin America
It’s harder to find one clear “adoption rate” number for Southeast Asia, Africa, and Latin America like we can for the EU. Surveys are often done differently from country to country, so the numbers don’t always line up.
That said, government and regional activity shows that AI use is moving quickly. In Southeast Asia, for example, regional efforts through ASEAN [26] to create AI governance guidelines suggest that governments know businesses are adopting AI faster than rules and oversight systems can keep up. [27]
In Africa and Latin America, it helps to look at broader international estimates. Reports from the International Monetary Fund [28] and the International Labour Organization[29] show that lower-income countries often have less direct exposure to AI replacing jobs. That’s mainly because a larger share of work is physical or non-routine, which is harder to automate.[30]
Mechanisms through which AI changes labor markets
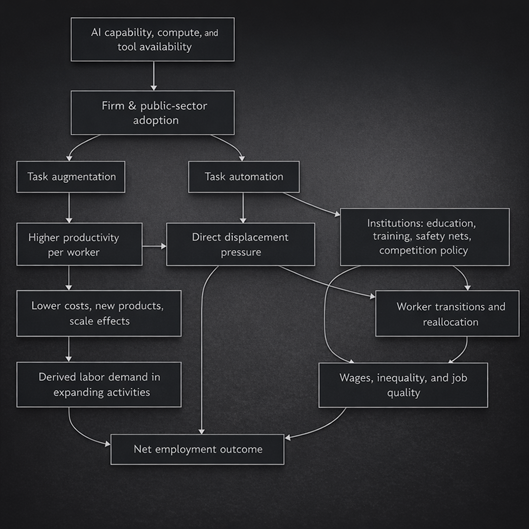
Research and policy reports mostly agree on five ways AI can change jobs and wages. What you end up with overall depends on how these five forces add up:
- AI taking over parts of work (automation)
- AI helping people do parts of work faster or better (augmentation)
- New roles and new types of work appearing (job creation)
- The messy part of switching (layoffs, hiring delays, retraining time, pay cuts during transitions)
- Productivity changes (more output with the same number of people, which can lower costs and shift demand).[31]
Task automation and task augmentation
AI usually replaces tasks, not entire jobs. One analysis from the ILO that looks specifically at generative AI finds that clerical-style roles are among the most exposed, because a large chunk of the work is text, forms, routine documentation, and standard communications. That means the first pressure points tend to be admin-heavy areas like finance back offices, public administration paperwork, and customer operations. [32]
At the same time, AI can also make workers more productive. Big-picture reviews of generative AI commonly highlight that language-heavy activities are where the impact shows up fastest: writing drafts, summarizing, coding support, translating, and handling customer questions. In many cases, this expands how much work one person can get through (or how many tasks they can cover), rather than automatically removing the job. [33]
Displacement and transition frictions
People get displaced when AI takes over certain tasks, and the company can’t (or won’t) move affected staff into other growing work. Even if the total number of jobs doesn’t drop, the changeover can still hurt. Workers may deal with short-term unemployment, lower pay that lingers even after they find a new job, the inability to move for work, or requirements like degrees/certifications that block them from switching roles.
An OECD review on AI and work points out that outcomes depend a lot on speed and on the “shock absorbers” a country has in place, like training programs, how wages are negotiated, and safety nets. With the right setup, task changes can look like “people shift roles and wages rise.” Without it, it can turn into a split job market where some workers move up and others get stuck with lower security and weaker pay. [34]
These impacts also won’t be evenly spread. The ILO has noted that roles with more women, especially clerical and administrative jobs, can face higher automation risk than many male-dominated roles. [35]
Productivity, scale effects, and macro rebalancing
AI can raise productivity by cutting the time and labor needed for certain tasks. That can reduce costs, help companies offer new products, lower prices, and grow output.
Big economic forecasts don’t agree on how large the boost will be. Some estimates say generative AI could noticeably lift global productivity growth and raise GDP over about a decade if it spreads widely. More cautious models project smaller gains even out to the mid-2030s. [36]
Whether productivity gains lead to more jobs depends on a few practical things:
- Do lower prices cause customers to buy more (so firms need more staff overall)?
- Are markets competitive, or do a few players keep most of the gains?
- How quickly does new demand show up in “human-heavy” areas (like healthcare and elder care in aging countries, or infrastructure and formal services in emerging economies)? [37]
Methodology and scenarios for projections to 2035
This section lays out a task-based scenario approach you can actually check. Every key assumption is written down, explained, and tested to see how much it changes the results. The point is not to “predict 2035 exactly,” but to show what happens if certain conditions hold.
Data sources used
The projections mainly pull from three buckets of inputs:
- Adoption and rollout evidence from official stats and large surveys (for example, Eurostat’s data on how many businesses use AI).
- “Exposure” estimates from multilateral institutions (especially the IMF and ILO), which look at how much of current work could be affected by AI.
- Productivity impact ranges from macroeconomic and industry studies, used to set plausible “low-to-high” productivity boosts. [38]
How the model works
Let employment in region r, sector s be a 2025 index = 100. Employment changes over time come from three parts:
- Baseline (non-AI) trend
This is the “what would happen anyway” path, driven mostly by demographics and long-run economic shifts (broadly aligned with UN population projections).[39]
- AI-driven displacement (jobs reduced) – Job pressure increases when:
- the sector has higher task exposure,
- AI adoption is higher,
- and AI actually replaces a meaningful share of tasks (captured by a displacement factor that reflects partial automation rather than full replacement).
- AI-driven job creation (jobs added or expanded) – Job growth increases when:
- Productivity rises,
- The region can turn productivity into real demand (through investment, business growth, public spending capacity, etc.),
- and customers/markets respond by buying more or expanding services (sector demand responsiveness).
This approach reflects the IMF/ILO view that “exposure” is large but does not mechanically imply job loss; outcomes depend on institutions and demand. [1]
Scenario definitions
The three scenarios mainly differ in two things: (1) how fast AI spreads across companies and sectors; (2) how big the overall productivity boost turns out to be by 2035 (based on ranges already published in the literature).
Here’s what changes across them:
Conservative scenario
- AI spreads slowly across firms and industries.
- By 2035, total productivity is about 1–2% higher than it would have been otherwise.
- This lines up with the more cautious economic estimates that assume slower rollout, uneven adoption, and limited follow-through on organizational change. [40]
Moderate scenario
- AI spreads broadly across most major sectors.
- By 2035, productivity is roughly 3–4% higher than baseline.
- This reflects middle-of-the-road estimates where many firms adopt AI tools and reorganize work, but gains are gradual and uneven. [41]
Rapid scenario
- AI spreads quickly and is combined with other changes like robotics and process redesign.
- By 2035, productivity is about 5–7% higher than baseline.
- This assumes strong follow-through: firms don’t just add AI tools, they redesign workflows and invest in complementary systems. [42]
The baseline demographic direction is consistent with UN projections: faster working-age growth in Africa and parts of South Asia; aging and slower growth in Europe and East Asia. [43]
Causal mechanism flowchart
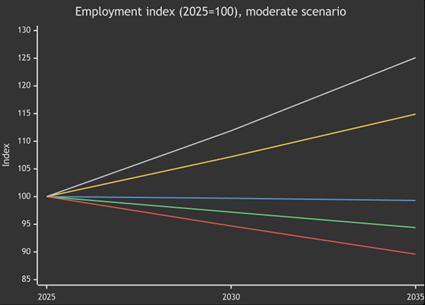
Quantitative projections to 2035 under three scenarios
The numbers below come from the scenario model described earlier. They are shown as employment indices, where 2025 = 100.
An index above 100 means employment is higher than in 2025. An index below 100 means it is lower. The percentage changes are measured relative to a baseline that already includes demographic and long-term structural trends.
Regional employment indices
The table shows projected employment levels in 2030 and 2035 for each region under the three scenarios (Conservative, Moderate, Rapid).
Conservative scenario (2025=100)
| Region | 2030 | 2035 |
| US | 100.2 | 100.4 |
| EU | 97.8 | 95.6 |
| China | 95.2 | 90.5 |
| India | 107.2 | 114.9 |
| Southeast Asia | 103.5 | 107.1 |
| Africa | 111.5 | 124.3 |
| Latin America | 102.4 | 104.9 |
Moderate scenario (2025=100)
| Region | 2030 | 2035 |
| US | 99.7 | 99.3 |
| EU | 97.2 | 94.4 |
| China | 94.7 | 89.6 |
| India | 107.2 | 114.9 |
| Southeast Asia | 103.4 | 106.9 |
| Africa | 111.9 | 125.1 |
| Latin America | 102.3 | 104.6 |
Rapid scenario (2025=100)
| Region | 2030 | 2035 |
| US | 99.2 | 98.3 |
| EU | 96.7 | 93.3 |
| China | 94.5 | 89.2 |
| India | 107.1 | 114.7 |
| Southeast Asia | 103.5 | 107.1 |
| Africa | 112.2 | 126.0 |
| Latin America | 102.2 | 104.5 |
Interpretation. In this model, the big differences across regions mainly come from two things: demographics, and whether job losses from AI are balanced out by new demand and new work.
Regions where the working-age population is growing quickly (like much of Africa and parts of Asia) can still see strong job growth even as AI spreads, because the labor force is expanding and the economy can keep adding roles. In aging regions (like the EU and China), there’s less built-in growth. That makes them more at risk of overall job declines if productivity gains don’t lead to enough extra demand for workers.
This “direction of travel” matches what UN demographic projections suggest, and it fits the common multilateral view that high AI “exposure” does not automatically mean job losses, because outcomes depend on demand and how economies adjust. [44]
Sectoral job gains and losses
Whether a sector gains or loses jobs in the model comes down to three practical factors:
- How much of the sector’s work can realistically be automated (task exposure and feasibility)
- How quickly firms in that sector actually roll AI out (adoption intensity)
- Whether demand grows enough to create or expand work in that sector (demand responsiveness)
Real-world patterns already hint at where change hits first. In the EU, AI use is already high in information and professional services, which suggests faster and deeper job-task changes there. Separately, evidence on robotics points to ongoing pressure in manufacturing and logistics, where automation has a longer track record and can scale in physical operations too. [45]
The matrix below shows the net AI employment effect by 2035 (percent vs baseline) in the moderate scenario. Positive means AI-linked demand expansion outweighs displacement within the sector; negative means the reverse.
| Sector → / Region ↓ | Africa | China | EU | India | Latin America | Southeast Asia | US |
|---|---|---|---|---|---|---|---|
| Manufacturing | -2.5 | -10.4 | -9.9 | -6.3 | -5.2 | -6.4 | -9.8 |
| Services (other) | +1.6 | -4.4 | -4.5 | -1.1 | -1.1 | -1.4 | -4.2 |
| Healthcare | +3.8 | -2.0 | -2.4 | +1.3 | +0.8 | +0.9 | -2.0 |
| Finance | -1.9 | -8.8 | -8.4 | -5.2 | -4.4 | -5.3 | -8.3 |
| Education | +1.6 | -2.3 | -2.5 | -0.2 | -0.3 | -0.4 | -2.3 |
| Agriculture | -0.5 | -4.9 | -4.8 | -2.6 | -2.2 | -2.7 | -4.7 |
| Logistics | -0.6 | -8.1 | -7.9 | -4.1 | -3.5 | -4.3 | -7.7 |
| Public sector | -0.6 | -5.0 | -4.8 | -2.7 | -2.3 | -2.8 | -4.7 |
Interpretation. Three patterns stand out:
- Manufacturing and logistics take the biggest hit in the model. That fits what we already see with robotics, automation on shop floors and warehouses, and ongoing process optimization in supply chains. [21]
- Finance also looks exposed. A lot of finance work is already digital and built around documents, numbers, rules, and analysis, which lines up closely with what generative AI is good at (and can partially automate). [46]
- Healthcare and education can land closer to neutral or even positive in places where demand is high and services are undersupplied. The idea isn’t that AI can’t affect these jobs. It’s that the need for care and teaching can grow fast enough that added demand outweighs the automation pressure, especially where there are shortages or big unmet needs.[37]
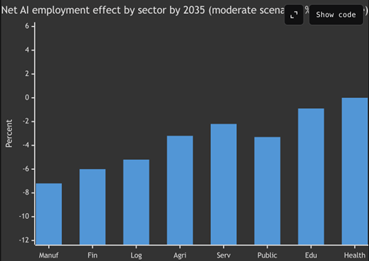
Note: This bar chart shows the model’s average results across the regions discussed above. It is not an official global forecast.
The sector patterns shown are based on how exposed different types of tasks are to AI, not on measured job losses so far. In other words, the chart reflects the model’s logic about likely pressure points, rather than confirmed employment changes to date. [47]
Skill demand shifts and job composition changes
Why skills matter as much as jobs
Most solid assessments don’t expect AI to wipe out whole occupations overnight. Instead, the bigger and faster change is that the mix of skills inside many jobs shifts. People keep the same job title, but the day-to-day work tilts toward new tools, new checks, and new workflows. [48]
From 2020 to 2025, a few signals suggest this “skill rebalancing” is already happening:
- Companies are increasingly looking for AI-ready capabilities like getting data organized, setting up rules and oversight (governance), and integrating AI into existing systems as adoption grows. [49]
- In some areas, employees are already using AI tools regularly even when official company-wide rollout still looks limited on paper. [50]
- Many fast-growing AI use cases are focused on language-based work (for example, text mining and natural language generation in Eurostat’s categories). [15]
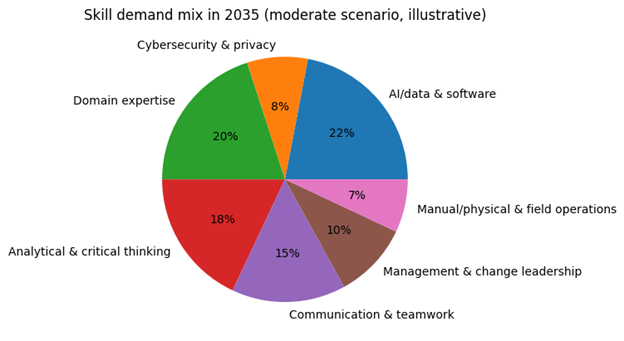
Illustrative skill-mix projection to 2035
he chart below is an example of what the mix of skills employers look for in 2035 might look like under the moderate scenario. It’s not claiming precise percentages. It’s meant to match the direction suggested by OECD/ILO findings and what large employer surveys are picking up:
- More demand for AI/data/software comfort (being able to work alongside AI tools)
- More demand for governance, privacy, and risk controls (knowing what’s allowed, what’s safe, what needs review)
- More demand for change-management skills (updating processes, training teams, redesigning work)
- Continued importance of domain expertise (knowing the industry) and people skills (communication, trust, care, teaching, leadership) [51]
Job composition implications by sector
Manufacturing and logistics
AI and automation usually cut down on routine watching, scanning, and repetitive picking/handling. At the same time, they increase the need for people who can keep automated systems running and safe. Expect more work in:
- Maintenance and troubleshooting
- Systems setup and integration (machines, sensors, software)
- Safety checks and incident responses
- Process improvement and quality control
Bottom line: fewer “repeat the same move all day” tasks, more technician and process-focused roles. [21]
Finance
Routine back-office work (paperwork, standard checks, basic compliance processing) is where AI can take the most load off. What grows instead is work that needs judgment, accountability, and customer trust, such as:
- Model risk management (checking AI outputs and limits)
- Human-in-the-loop review and approvals
- Exception handling (the weird cases AI can’t safely decide)
- Customer-facing advisory work, especially where regulation is strict and trust matters
Bottom line: less routine processing, more oversight and higher-touch client work.[52]
Healthcare
AI tends to land first in admin and documentation: scheduling, billing, records, and support tools for clinicians. Core care work still needs people, and the human side becomes even more important:
- Care coordination across teams and systems
- Patient communication and follow-up
- Safety oversight (catching errors, monitoring quality)
- Using diagnostic support carefully, not blindly
Bottom line: admin gets streamlined, while care roles remain and shift toward coordination and safety. [53]
Education
Tools can help create materials and offer tutoring-style support, but schools still need people for the parts that require authority, context, and safeguarding:
- Classroom management and behavior support
- Motivation and relationship-building
Evaluation/grading that requires judgment and fairness - Student safety, supervision, and wellbeing
Bottom line: more tool-assisted prep and practice, but teaching stays people-led where it counts. [54]
Public Sector
AI can speed up services that involve lots of forms and documents, but deployment is usually shaped by rules and accountability:
- Faster document handling and case processing
- More consistent responses for standard inquiries
- Strong need for governance: procurement rules, audits, transparency, appeals, and data protection
Bottom line: potential for quicker service, but rollout is slower and more controlled because public accountability is high. [55]
Uncertainty analysis and limitations
Parameter uncertainty and sensitivity
Because “AI adoption” isn’t just one simple thing, the results can swing a lot depending on three practical inputs:
- How fast AI spreads (adoption speed)
- How strongly task automation turns into fewer jobs (the displacement factor: do firms cut headcount, or just reshuffle work?)
- How much productivity turns into more demand (do lower costs and better output lead to more sales/services and therefore more hiring?)
These are the same “middle steps” highlighted in OECD/IMF/ILO frameworks: exposure alone doesn’t decide outcomes. The outcome depends on how adoption, workplace choices, and demand response interact. [31]
The table below summarizes uncertainty for the moderate scenario in a compact way. It reports the median result and the 10th to 90th percentile range for the net AI employment effect (percent relative to the baseline). These ranges come from a Monte Carlo run that varies key parameters (displacement factor, how much productivity is actually realized, and how strongly productivity turns into demand).
Important: these are model-based uncertainty ranges, not statistical “confidence intervals” from historical data.
| Region | Net AI effect (p10) | Median | Net AI effect (p90) |
|---|---|---|---|
| US | -6.9% | -5.4% | -3.9% |
| EU | -7.1% | -5.7% | -4.1% |
| China | -7.4% | -5.8% | -4.2% |
| India | -3.7% | -2.5% | -1.4% |
| Southeast Asia | -4.0% | -2.8% | -1.7% |
| Africa | -0.6% | +0.2% | +1.1% |
| Latin America | -3.2% | -2.3% | -1.4% |
Evidence-based caveats from 2020–2025
Three reminders that keep this from turning into an “AI will definitely destroy jobs” story:
- Past automation didn’t automatically wipe out jobs, even in roles that looked vulnerable. OECD evidence across several countries found that employment in “high automation-risk” occupations still grew. It just grew more slowly than in lower-risk occupations. That points to businesses reshuffling tasks and adjusting over time, not an immediate collapse. [56]
- “Adoption” numbers depend heavily on how you measure them. EU statistics often track specific AI technologies, some US surveys measure “AI use” in narrower ways, and workers can start using tools before companies officially roll them out. So adoption rates can look very different even when reality on the ground is similar. [57]
- Even if total employment stays stable, the winners and losers can shift a lot. The ILO’s findings on gender differences in exposure are a good example: if more women are concentrated in task profiles that are easier to automate (like clerical/admin work), inequality risks can rise even without a big change in the total job count. [35]
Policy recommendations for governments, firms, and workers
AI is a “general-purpose” technology, so its impact depends a lot on local rules and systems. The same AI tools can lead to better jobs and higher pay in one country, and more job insecurity and a split workforce in another, depending on how institutions handle the transition. [31]
Governments
Governments can lower the “transition cost” of AI adoption (job gaps, long-term pay hits, growth of informal work) by updating labor-market systems so they keep pace with how fast AI spreads:
- Build task-based labor market tracking. Don’t only track job titles. Track what tasks are changing, what tools people are using, and what skills employers are asking for in job postings. Statistical agencies should expand how they measure AI use and AI-related work practices. Eurostat-style business surveys are a useful template. [58]
- Scale practical re-skilling with credentials employers trust. The biggest risk isn’t “everyone.” It’s that workers are concentrated in routine information processing and clerical tasks. Prioritize short, stackable credentials that lead to real job moves, like digital operations, data handling, and AI oversight/review. That lines up with the ILO’s task-based exposure findings. [59]
- Update safety nets for more frequent job switching. If adoption speeds up, more people will cycle through job changes. Portable benefits and active labor market programs (job matching, wage support, targeted training) can reduce the risk that displacement falls hardest on already vulnerable groups. [60]
- Treat AI governance as part of economic policy.Clear rules on data protection, accountability, liability, and procurement reduce uncertainty that companies often cite as a barrier to adoption, while also preventing a “race to the bottom” on standards.[61]
Firms
Firms play the biggest role in deciding whether AI leads to better jobs or just more disruption. The same technology can improve work, or create churn, depending on how it’s managed.
- Redesign workflows, not test tools alone. Many organizations run AI pilots, but real value comes from changing how work is organized. That means cleaning up data, connecting systems, and putting clear rules in place, especially in regulated sectors like finance and public services. [62]
- Make human oversight a formal function. AI can make mistakes, and in some industries those mistakes are expensive or risky. Companies should treat review and quality control as core roles, including data curation, model monitoring, and responsible AI oversight. These are already emerging as recognized job areas. [63]
- Plan workforce transitions early. In areas where routine work is likely to shrink (like back-office processing or parts of logistics), firms should build internal transfer paths and retraining options. Moving people into growing roles is often cheaper and smarter than layoffs, and it keeps valuable institutional knowledge in-house. [64]
Workers and worker organizations
Workers are most exposed when they stay locked into shrinking task bundles and don’t have a clear path into growing ones.
- Build AI-adjacent skills that strengthen your core expertise. The goal usually isn’t to “become an AI engineer.” It’s to be the domain expert who can use AI tools effectively, checking outputs, writing better prompts, understanding data basics, and improving workflows. That combination is often more secure than pure technical specialization.[65]
- Focus on portable proof of skills. As work changes, demonstrated ability can matter more than job titles. Certifications, portfolios, and clear evidence of output can help workers move across firms and sectors, especially in fast-growing service areas. [66]
- Push for transparency and fair evaluation. AI-based monitoring and algorithmic management can change how performance is judged. Worker representation and collective bargaining can help ensure explainability, due process, and safe deployment standards. [67]
References
[1] (also cited as [30], [47])
European Commission, Eurostat. (2025, December 11). 20% of EU enterprises use AI technologies.
https://ec.europa.eu/eurostat/web/products-eurostat-news/w/ddn-20251211-2
[2] (also cited as [13], [23], [50], [65])
Board of Governors of the Federal Reserve System. (2024, February 5). Measuring AI uptake in the workplace. FEDS Notes.
https://www.federalreserve.gov/econres/notes/feds-notes/measuring-ai-uptake-in-the-workplace-20240205.html
[3] (also cited as [52], [59])
SGH Warsaw School of Economics. (n.d.). Generative AI and jobs: An analysis of potential effects on global employment.
https://gnpje.sgh.waw.pl/Generative-AI-and-Jobs-An-Analysis-of-Potential-Effects-on-Global-Employment%2C203716%2C0%2C2.html
[4] (also cited as [21])
International Federation of Robotics. (2025, September 25). China tops world record of 2 million factory robots [Press release].
https://ifr.org/downloads/press_docs/2025-09-25-IFR_press_release_China_in_English.pdf
[5] (also cited as [7], [15], [17], [29], [45], [55])
European Commission, Eurostat. (n.d.). Use of artificial intelligence in enterprises (Statistics Explained).
https://ec.europa.eu/eurostat/statistics-explained/index.php/Use_of_artificial_intelligence_in_enterprises
[6] (also cited as [14], [38], [57], [58])
European Commission, Eurostat. (2025, December 11). 20% of EU enterprises use AI technologies.
https://ec.europa.eu/eurostat/web/products-eurostat-news/w/ddn-20251211-2
[8] (also cited as [28])
Economic Innovation Group. (n.d.). How many businesses are using AI?
https://eig.org/how-many-businesses-are-using-ai/
[9] (also cited as [16], [19])
Reuters. (2024, July 9). China leads world adoption of generative AI, survey shows.
https://www.reuters.com/technology/artificial-intelligence/china-leads-world-adoption-generative-ai-survey-shows-2024-07-09/
[10] (also cited as [24])
Press Information Bureau, Government of India. (n.d.). Press release (PRID: 2209737).
https://www.pib.gov.in/PressReleasePage.aspx?PRID=2209737&lang=2
[11] (also cited as [31], [34], [37], [48], [51], [53], [60], [64], [67])
Organisation for Economic Co-operation and Development. (2024). Using AI in the workplace.
https://www.oecd.org/content/dam/oecd/en/publications/reports/2024/03/using-ai-in-the-workplace_02d6890a/73d417f9-en.pdf
[12] (also cited as [39], [43], [44])
United Nations, Department of Economic and Social Affairs, Population Division. (2024). World population prospects 2024: Summary of results.
https://population.un.org/wpp/assets/Files/WPP2024_Summary-of-Results.pdf
[18] (also cited as [20], [49], [61], [62], [63])
Reuters. (2025, December 15). Italian firms using AI double year, still small minority.
https://www.reuters.com/business/italian-firms-using-ai-double-year-still-small-minority-2025-12-15/
[22] (also cited as [36], [42])
Goldman Sachs. (2023). Generative AI could raise global GDP by 7%.
https://www.goldmansachs.com/insights/articles/generative-ai-could-raise-global-gdp-by-7-percent
[25] (also cited as [26], [66])
Reuters. (2025, February 10). GenAI boosts India’s IT industry’s productivity by up to 45%, EY India survey shows.
https://www.reuters.com/technology/artificial-intelligence/genai-boost-indias-it-industrys-productivity-by-up-45-ey-india-survey-shows-2025-02-10/
[27] (also cited as [54])
ASEAN. (2025). Expanded ASEAN guide on AI governance and ethics: Generative AI.
https://asean.org/wp-content/uploads/2025/01/Expanded-ASEAN-Guide-on-AI-Governance-and-Ethics-Generative-AI.pdf
[32]
Gmyrek, P., Berg, J., & Bescond, D. (2024, May). Generative AI and jobs: Policies to manage the transition. United Nations (SDGs).
https://sdgs.un.org/sites/default/files/2024-05/Gmyrek%3B%20Berg%3B%20Bescond_Generative%20AI%20and%20Jobs.pdf
[33] (also cited as [46])
McKinsey Global Institute. (2023). The economic potential of generative AI: The next productivity frontier.
https://www.mckinsey.de/~/media/mckinsey/locations/europe%20and%20middle%20east/deutschland/news/presse/2023/2023-06-14%20mgi%20genai%20report%2023/the-economic-potential-of-generative-ai-the-next-productivity-frontier-vf.pdf
[35]
Reuters. (2025, May 20). AI poses a bigger threat to women’s work than men’s, says report.
https://www.reuters.com/business/world-at-work/ai-poses-bigger-threat-womens-work-than-mens-says-report-2025-05-20/
[40] (also cited as [41])
Wharton Budget Model. (2025, September 8). The projected impact of generative AI on future productivity growth.
https://budgetmodel.wharton.upenn.edu/issues/2025/9/8/projected-impact-of-generative-ai-on-future-productivity-growth
[56]
Organisation for Economic Co-operation and Development. (2023). What happened to jobs at high risk of automation?
https://www.oecd.org/en/publications/what-happened-to-jobs-at-high-risk-of-automation_10bc97f4-en.html